Matlab: 2 Methods of Generating a Rainbow
In my data visualization class, we had an assignment to create a “rainbow” (create and display 128 vertical stripes of color in one image, in RGB sequence). Something like this:
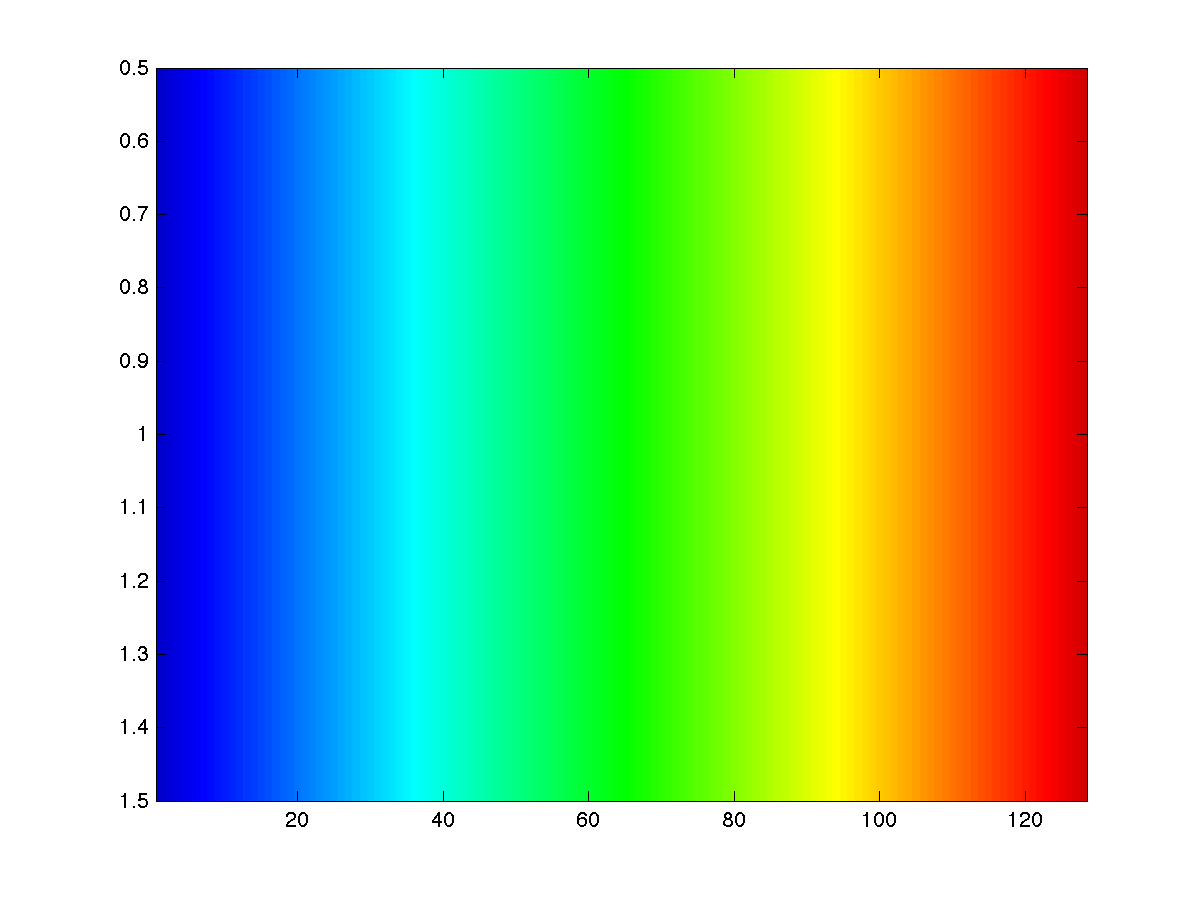
In Matlab, a colormap is an m-by-3 matrix of real numbers between 0.0 and 1.0. Each row is an RGB vector that defines one color. The [R,G,B] color attribute value for a dataset with attribute value ranging between 0 and 1.
My original solution is:
image(1:128);
colormap(jet(128))
print -dpng 'rainbow.png'
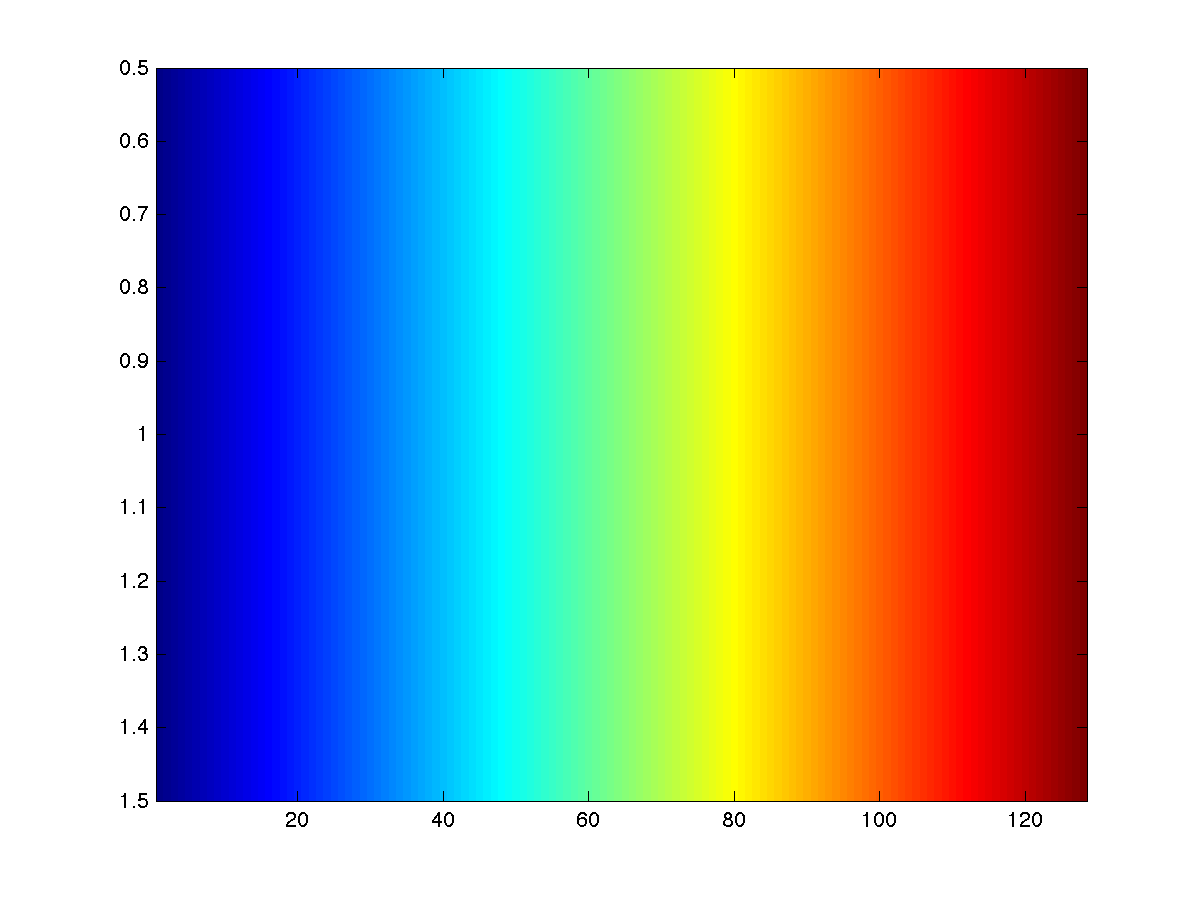
The command colormap(jet(128)) creates a rainbow colormap with 128 colors. Files in the color folder generate a number of colormaps, and each file (in this case, “jet”) accepts the colormap size as an argument. While this solution is certainly concise and clear, it is not the solution the professor is looking for. It turns out that the professor wants the map to be generated algorithmically (instead of using a built-in file from the color folder).
My second solution is:
image(1:128);
R(128,1) = 0;
G(128,1) = 0;
B(128,1) = 0;
dx = 0.8;
for f=0:(1/128):1
    g = (6-2*dx)*f+dx;
    index = int16(f*128 + 1);
    R(index,1) = max(0,(3-abs(g-4)-abs(g-5))/2);
    G(index,1) = max(0,(4-abs(g-2)-abs(g-4))/2);
    B(index,1) = max(0,(3-abs(g-1)-abs(g-2))/2);
end
%concatenate arrays horizontally
map = horzcat(R, G, B);
%map colors onto image
colormap(map)
print -dpng 'rainbow.png'
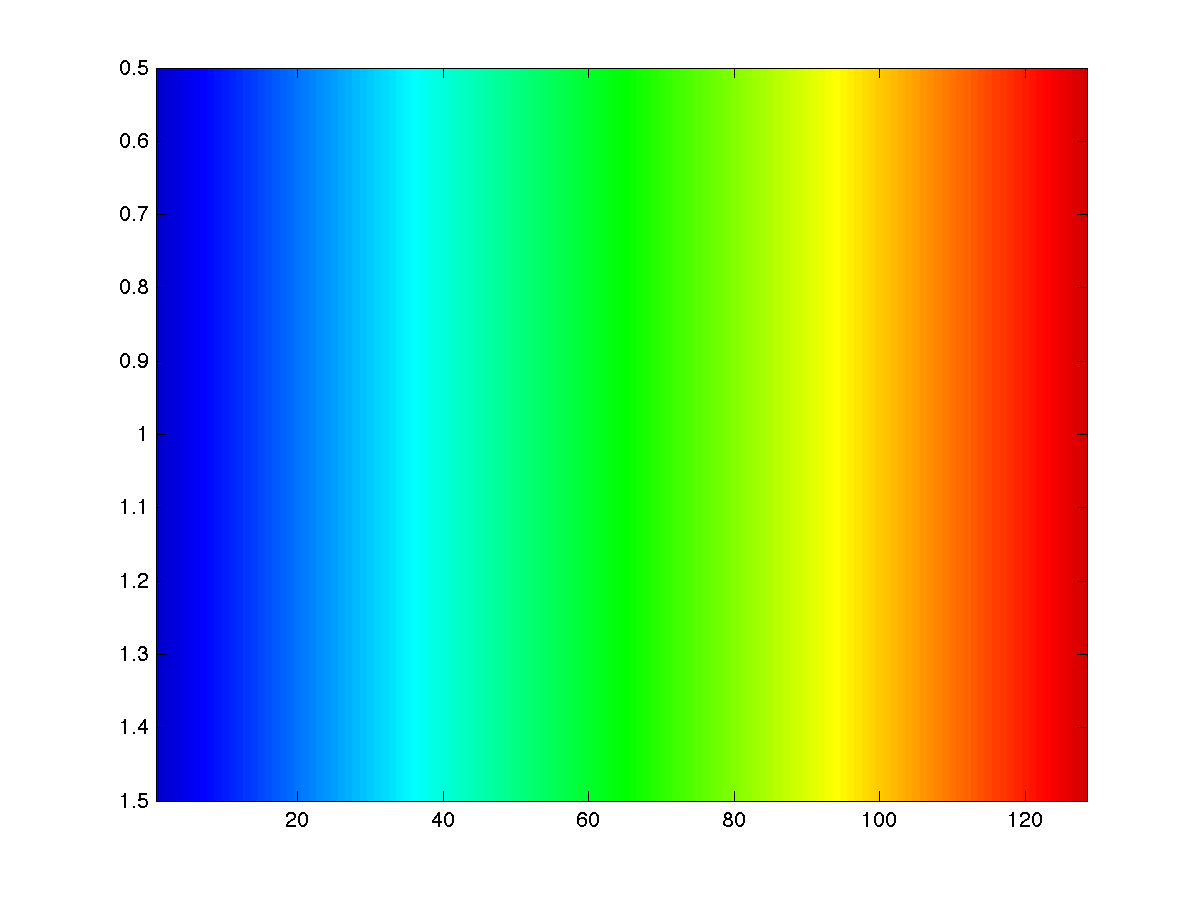
This creates a different rainbow and satisfies the professor’s algorithmic requirement.
Code cow-code / rainbow.m
Comments from the old blog (2)
Recovered from the Wayback Machine of the old site after my back-up servers got black-hatted.
But can’t you do it by multiplying each color by a stochastic matrix to get the next one?
This is amazing work!
I’m wondering if the author could also consider the purple color?
Thanks